Approximately how many bills are introduced and/or passed within a week?
The number of bills – proposed laws—introduced, debated and passed by the Australian Parliament during a sitting week can vary greatly. The number of bills passed by both Senate and House of Representatives, and signed into law by the Governor-General over the life of a parliament also varies.
The House of Representatives has put together an interesting table of statistics about this topic, dating back to 1901. Click on ‘General statistics’. Using this table, you can see that the largest number of bills passed into law in one year is 264 (in 1992) and the smallest number of bills passed into law in one year is 12 (in 1907).
The average number of laws made per year since 1901 is 109. The Parliament has gotten busier in recent decades and the average number of laws made per year for the period 2013–2022 is 139.
This table does not list how many bills have been presented to the Senate each year. You can find a record of all the bills passed by the Senate in each Parliament going back to the 31st Parliament (1978-80) here.
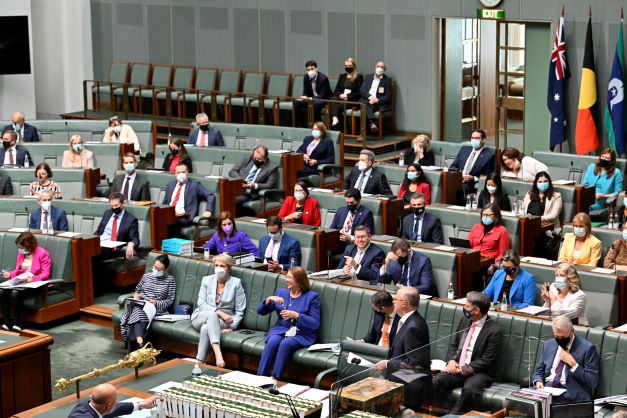
The government side of the House of Representatives.
Penny Bradfield/DPS AUSPIC
The government side of the House of Representatives.
Penny Bradfield/DPS AUSPIC
Description
The Prime Minister stands and speaks at the table in the House of Representatives. Members of the government sit in the 5 rows behind him.
Permission should be sought from DPS AUSPIC for third-party or commercial uses of this image. To contact DPS AUSPIC email: auspic@aph.gov.au or phone: 02 6277 3342.